R
Ray Maple
Symbol pendingFiledRay Maple Inc. · Nasdaq Capital Market (application pending) · IT consulting and digital marketing · Research source · F-1 · 2026/08/18 · SEC checked 2026-10-19
Latest filing update · F-1
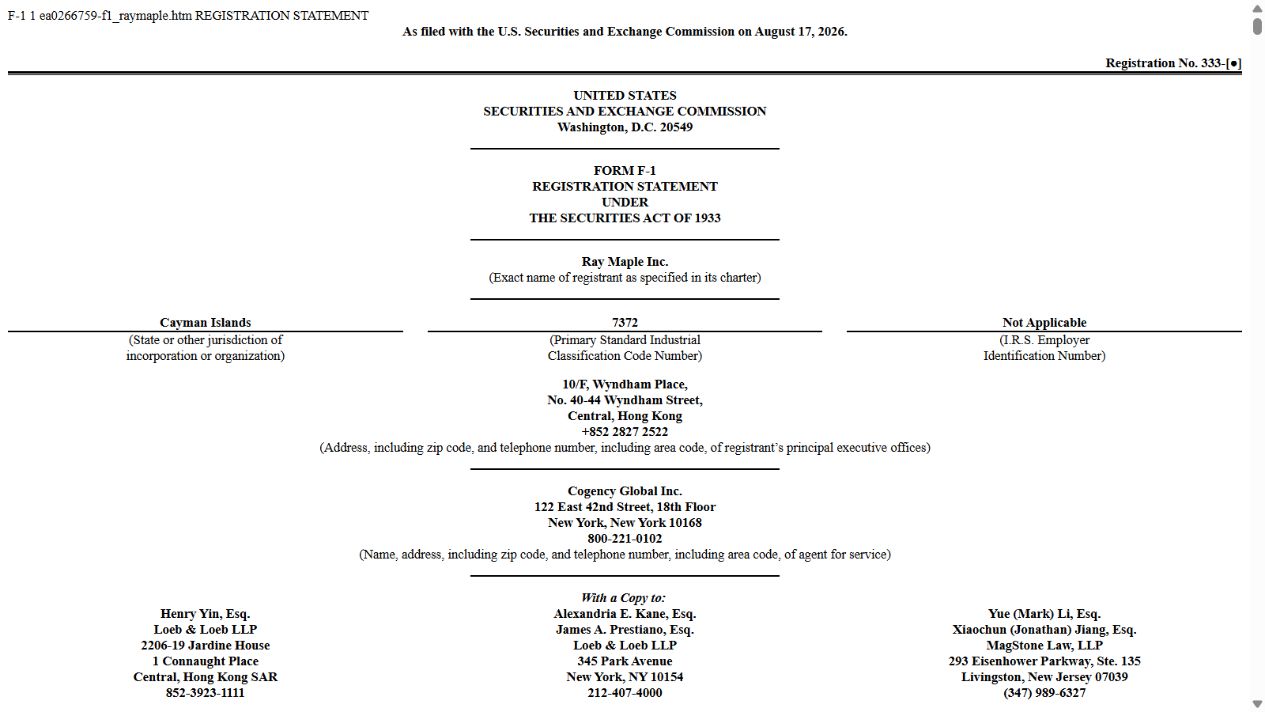
Ray Maple proposes to offer 6,250,000 ordinary shares at an assumed $4.00 per share, with a 15% over-allotment option, subject to SEC effectiveness and Nasdaq approval.
Research source · F-1 · 2026/08/18Latest analyzed filing · F-1 · 2026-08-18
Updates and this research have separate source dates; newer facts do not silently replace earlier conclusions.
SummaryWATCHReport source · F-1
Profitable growth is visible, but valuation, minimal cash and post-lock-up supply warrant caution
FY2026 revenue grew 61.3% to $2.39M, although net income slipped to $818K and year-end cash was only $754. At $4.00, the filing implies a $75M post-offer equity value, about 31× revenue; 12.5M existing shares become eligible after the 180-day lock-up, compared with 6.25M IPO shares.
- Business and development direction
A Hong Kong operating group providing IT solution consulting, system integration and digital marketing services.
Current business IT consulting and digital marketing100%
Future development Acquisitions40%
Market development30%
Working capital30%
DECISION DRIVERS
Key risks
High
Risk 1
The $75M implied value is about 31× FY2026 revenue.
High
Risk 2
Cash was only $754 and operating cash flow was negative despite reported profit.
High
Risk 3
12.5M existing shares equal twice the IPO share count and may become sale-eligible after 180 days.
OFFERING AT A GLANCE
F-1 ↗Capital raised and seller liquidity
- Primary shares
- 100%
- Secondary shares
- 0%
- Issuer proceeds
- $22.219M estimated
- Selling-holder proceeds
- $0 disclosed
Use-of-proceeds percentages disclosed in the F-1 scenario.
BOOKRUNNERS / LEAD UNDERWRITERSUnderwriters named in the prospectus
PRELIMINARY| # | Institution | Underwriting allocation | Ratio | Shares |
|---|---|---|---|---|
| 1 | Eddid Securities USA Inc. |
Underwriting terms
| Measure | Reported value | Unit |
|---|---|---|
| Underwriting discount per share | $0.28 | $ / share |
| Total underwriting discount | $1,750,000 | $ |
Source and calculation
Base prospectus offering; cover per-share and total columns Figures retain their stated source scenario and conditions.
Underwriting discount per share
Base prospectus offering; cover per-share and total columns
SEC table 8 row 3; source 48736:51798; SHA256 d03f9ba9eac62ccb60a020de6af586cfcd56916c1b2e3d8ac380c0d4fd578a67 ↗Base prospectus offering; cover per-share and total columns Figures retain their stated source scenario and conditions.
Total underwriting discount
Base prospectus offering; cover per-share and total columns
SEC table 8 row 3; source 48736:51798; SHA256 d03f9ba9eac62ccb60a020de6af586cfcd56916c1b2e3d8ac380c0d4fd578a67 ↗IPO CAPITAL QUALITY
Issuer capital$22.219M estimated
Selling-holder liquidity$0 disclosed
Primary shares100%
Secondary shares0%
100%
primary · SharesSecondary shares · Shares
| Calculation | Reported value |
|---|---|
| Issuer capital | $22.219M estimated |
| Selling-holder liquidity | $0 disclosed |
| Use of proceeds | Reported value |
|---|---|
| Acquisitions | 40% |
| Market development | 30% |
| Working capital | 30% |
Basis and evidence
Use-of-proceeds percentages disclosed in the F-1 scenario. Company: estimated net proceeds
The filed offer is primary and the intended allocation is fully quantified, but the planned acquisition spending increases execution risk.
Offering structure
| Measure | Reported value | Unit |
|---|---|---|
| Offering price | $4 | $ / share |
| Gross offering amount | $25,000,000 | $ |
Source and calculation
Base prospectus offering; cover per-share and total columns Figures retain their stated source scenario and conditions.
Offering price
Base prospectus offering; cover per-share and total columns
SEC table 8 row 2; source 48736:51798; SHA256 d03f9ba9eac62ccb60a020de6af586cfcd56916c1b2e3d8ac380c0d4fd578a67 ↗Base prospectus offering; cover per-share and total columns Figures retain their stated source scenario and conditions.
Gross offering amount
Base prospectus offering; cover per-share and total columns
SEC table 8 row 2; source 48736:51798; SHA256 d03f9ba9eac62ccb60a020de6af586cfcd56916c1b2e3d8ac380c0d4fd578a67 ↗Proceeds and intended uses
| Measure | Reported value | Unit |
|---|---|---|
| Issuer proceeds before expenses | $23,250,000 | $ |
Source and calculation
Base prospectus offering; cover per-share and total columns Figures retain their stated source scenario and conditions.
Issuer proceeds before expenses
Base prospectus offering; cover per-share and total columns
SEC table 8 row 4; source 48736:51798; SHA256 d03f9ba9eac62ccb60a020de6af586cfcd56916c1b2e3d8ac380c0d4fd578a67 ↗Dilution and valuation
| Calculation | Shares | Value | Reference |
|---|---|---|---|
| Pre-offer | 12.50M | $50.0M | $4.00 |
| Post-offer | 18.75M | $75.0M | +50.0% |
| IPO proceeds | 6.25M | $25.0M | 33.33% post |
| Calculation | Value | Reference |
|---|---|---|
| FY2026 revenue | $2.391M | 31.4× value/revenue |
Share-count comparison
SharesOffering cases as stated in the saved report, not funding-round history or shareholder-group ownership.
Pre-offer
12.50M
Post-offer
18.75M
| Stage / scenario | Reported value |
|---|---|
| Pre-offer | 12.50M |
| Post-offer | 18.75M |
Basis and evidence
Pre-offer
Share count on the saved valuation table's stated basis. Option and plan-reserve cases are conditional, not confirmed issued shares.
Capitalization / saved valuation bridge ↗Post-offer
Share count on the saved valuation table's stated basis. Option and plan-reserve cases are conditional, not confirmed issued shares.
Capitalization / saved valuation bridge ↗SCENARIO · NOT A FORECAST
IPO valuation scenario simulator
Post-offer · US$4 × 18.75M shares
Sources and calculation notes
Read this report’s SEC filing ↗
| View | Source basis |
|---|---|
| Ownership across stages | Comparable ownership figures across stages are unavailable in this report. See Control for holdings on their disclosed basis. Open filing ↗ |
CONTROLLING PARTYNo single controlling party identified
Base post-offer ownership
- Voting
- One vote / share
- Economic
- Largest 30.93%
- As of
- 2026/08/18
!Existing holders retain 66.67% collectivelyView source ↗
Relationship filters
ownership / voting rights
| Entity / holder | Economic ownership | Relationship |
|---|---|---|
| Lina Tang / RTLN | 30.93% | Major ownership group |
| Other existing holders | 35.74% | Major ownership group |
| IPO investors | 33.33% | Public / new investors |
Select for details · Ray Maple
Economic ownership100%
- Lina Tang / RTLN 30.93%
- Other existing holders 35.74%
- IPO investors 33.33%
Why control differs from ownership
Lina Tang holds 5.8M shares through RTLN Global Limited.
Liying Wang holds 8.13% post-offer and RSYH holds 27.60%.
All shares carry one vote; no dual-class structure is disclosed.
Existing holders own 66.67% after the base offering.
Conditional lock-up timeline
Conditional lock-up timeline
Eligibility is not a sale. Release conditions, holder groups and exceptions remain separate.
Milestones and unconfirmed releases
| Holder / event | Term / date | Conditions |
|---|---|---|
| Insider lock-up | +180 days 66.67% · 12.50M existing shares | Insider lock-up · Directors, officers and existing holders · Not yet published — awaiting the effective or final prospectus. · 180 days after commencement of sales; underwriter may waive · Cumulative: 18.75M (100% potential share base) · No trading-volume basis is available; calculate after 20 trading sessions. |
Basis and evidence
Insider lock-up
Insider lock-up · Directors, officers and existing holders · Not yet published — awaiting the effective or final prospectus. · 180 days after commencement of sales; underwriter may waive · Cumulative: 18.75M (100% potential share base) · No trading-volume basis is available; calculate after 20 trading sessions.
Lock-up / shares eligible for future sale ↗Sources and calculation notes
Read this report’s SEC filing ↗
| View | Source basis |
|---|---|
| Potential supply pressure | This saved report has no compatible source inputs for this calculation. Open filing ↗ |
Financial quality
Bars compare absolute amounts within each measure. Each measure has its own scale.
Revenue
USD · Annual values as reported · ConsolidatedFY2025USD 1,482,761
FY2026USD 2,391,339
| Calculation | Reported value | Reference |
|---|---|---|
| RevenueFY2026 · Consolidated | USD 2,391,339 | FY2026; consolidated; USD; year ended 2026-03-31 |
| RevenueFY2025 · Consolidated | USD 1,482,761 | FY2025; consolidated; USD; year ended 2025-03-31 |
| FY2026 net income | $0.818M | -2.7% |
| Operating cash flow | $(46K) | negative |
| Cash | $754 | 2026/03/31 |
| Working capital | $0.874M | 2026/03/31 |
Sources and calculation notes
Read this report’s SEC filing ↗
| View | Source basis |
|---|---|
| Financial review | Reported financial figures are shown above. A cash-runway estimate needs compatible cash-flow and funding assumptions. Open filing ↗ |
LATEST COMPARISON
Open F-1 ↗Baseline filing — comparison pending
No source-comparable material changes identified in this report.
Why it mattersChanges valuation, proceeds and first-day return assumptions.
Evidence · F-1 · 2026/08/18F-1
• 6.25M shares and $4.00 expected price filed
• Nasdaq symbol and effectiveness remain pending
The $75M implied value is about 31× FY2026 revenue.
- Potential impact
- High
- Evidence
- F-1 · 2026/08/18 ↗
Cash was only $754 and operating cash flow was negative despite reported profit.
- Potential impact
- High
- Evidence
- F-1 · 2026/08/18 ↗
12.5M existing shares equal twice the IPO share count and may become sale-eligible after 180 days.
- Potential impact
- High
- Evidence
- F-1 · 2026/08/18 ↗
Project-based revenue and Hong Kong concentration can make results volatile.
- Potential impact
- Medium
- Evidence
- F-1 · 2026/08/18 ↗
DocumentF-1SEC registration statement
Filed2026/08/181 public filings identified
Source-bound table inputs7SEC EDGAR
Sources and calculation notes
Price, shares, ownership, use of proceeds and audited FY2026 financials filed
View the filing's actual first page +